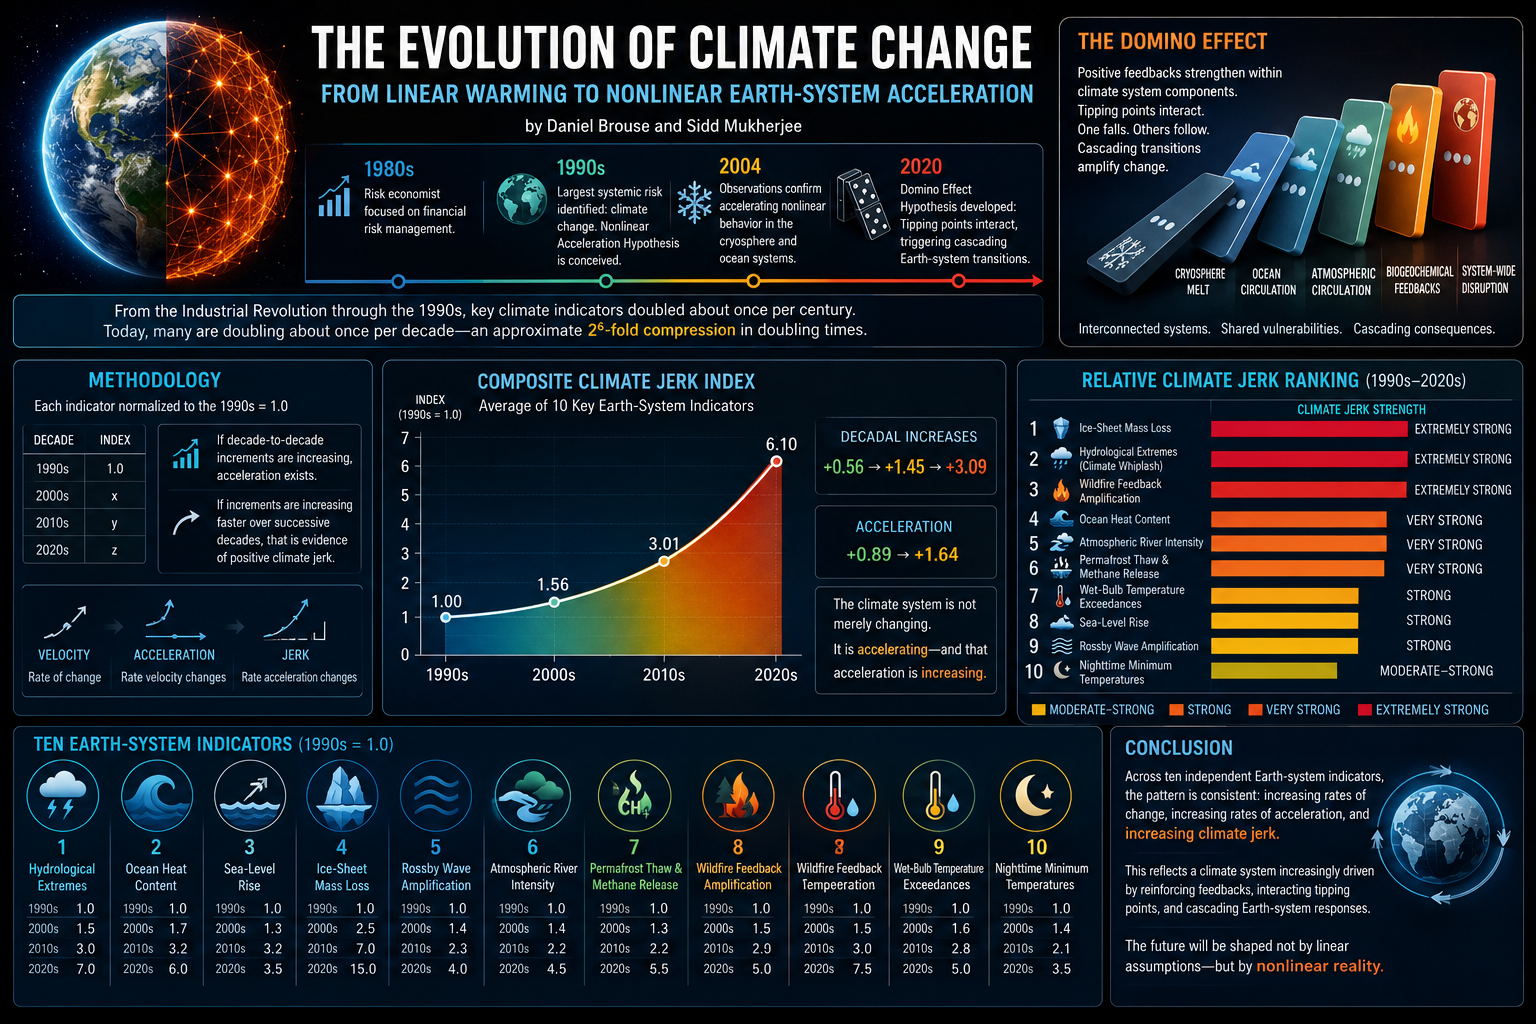
The Evolution of Climate Change: From Linear Warming to Nonlinear Earth-System Acceleration
2Independent Physicist, Membrane Institute, USA
Feedback Loops → Acceleration → Tipping Points → Acceleration → Domino Effect
Feedback loops amplify climate change and can push interconnected Earth systems past critical tipping points. As tipping points are crossed, they can trigger additional feedback loops and destabilize other climate systems. This cascading "Domino Effect" compresses timescales, accelerates change, and increases the risk of rapid, nonlinear climate transformations.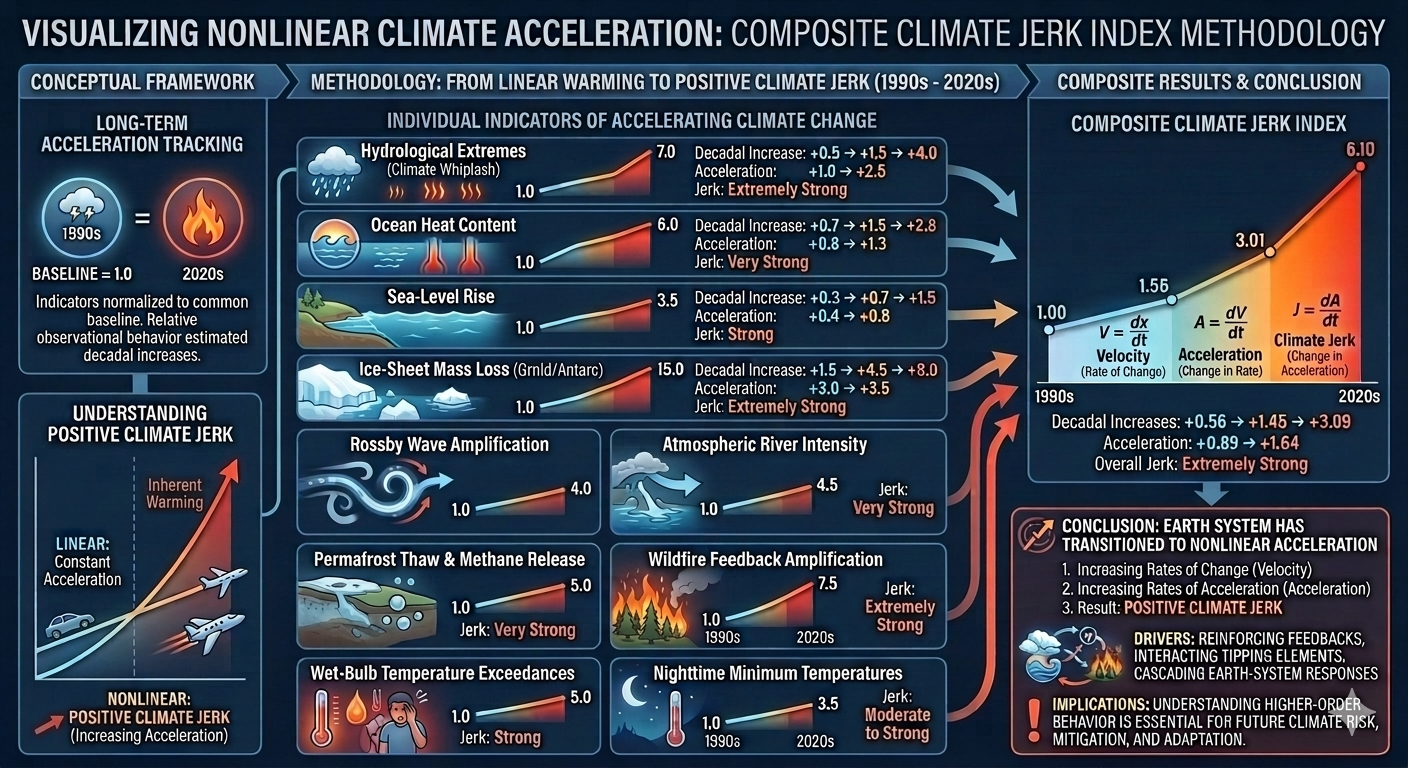
Introduction
During the 1980s, I worked primarily as an economist specializing in risk management. By the early 1990s, however, it had become clear that the greatest systemic risk facing civilization was not financial—it was climate change.
Working with physicist Sidd Mukherjee, we began developing what we called the Nonlinear Acceleration Hypothesis: the idea that climate change would not progress as a slow, linear process, but instead would accelerate as reinforcing Earth-system feedbacks became increasingly dominant.
Over the past three decades, an expanding body of observational evidence has increasingly supported this perspective. Today, nonlinear climate dynamics, positive feedbacks, tipping points, and cascading Earth-system interactions have become central concepts within modern climate science and climate-risk research.
From Linear Assumptions to Nonlinear Reality
By 1995, I had become convinced that many climate indicators were evolving exponentially rather than linearly. Sidd agreed the hypothesis was plausible but argued that a much longer observational record would be necessary before drawing firm conclusions.
At the time, most climate projections implicitly assumed relatively gradual warming. While serious, climate change was generally viewed as unfolding over centuries, leaving substantial time for adaptation and mitigation.
Yet observational evidence already suggested something different. Looking beyond annual variability, many climate indicators appeared to be accelerating.
By 2004, sufficient observations had accumulated to demonstrate nonlinear behavior across multiple components of the Earth system. Greenland Ice Sheet dynamics, in particular, were no longer consistent with simple equilibrium assumptions. Ocean heat uptake, ice-sheet mass loss, atmospheric moisture, and extreme precipitation all exhibited increasing rates of change.
A striking pattern emerged.
From the Industrial Revolution through approximately the 1990s, many leading indicators of climate change appeared to double on timescales approaching one century.
Today, many of those same indicators are doubling on timescales measured in roughly one decade.
This represents an approximate 2⁶-fold compression of doubling times over successive decades—a remarkable acceleration in the pace of climate change. Multiple climate indicators now point to rates of warming-related disruption far beyond those observed during the modern instrumental era. There is no well-established geological analog for a sustained, multi-variable, decade-scale pattern of accelerating change across the full Earth system at the resolution available in contemporary observations.
Rather than simply warming faster, the Earth system appears to be evolving into an increasingly nonlinear state in which the rate of change itself continues to accelerate.
If sustained, this may represent one of the most abrupt large-scale climate transitions in Earth’s geological history.
The Domino Effect
By 2020, our work expanded into what we termed the Domino Effect Hypothesis.
Many components of the climate system contain internal positive feedback mechanisms. As these feedbacks strengthen, the climate system becomes progressively less dependent upon external forcing because it increasingly reinforces its own evolution.
These critical threshold transitions are commonly known as climate tipping points.
Unlike gradual warming, tipping points exhibit nonlinear behavior in which relatively small additional forcing can produce disproportionately large—and potentially irreversible—changes.
Even more importantly, tipping points rarely occur in isolation.
The atmosphere, oceans, cryosphere, biosphere, and carbon cycle are tightly interconnected. Destabilization within one subsystem can reduce the stability of others, producing a sequence of interacting transitions throughout the Earth system.
This cascading behavior—often referred to as tipping cascades—forms the basis of the Domino Effect.
Since its proposal, extensive observational evidence has demonstrated that interacting climate feedbacks are a defining feature of modern climate dynamics and now occupy a central position within contemporary climate-risk literature.
Conclusion
Viewed collectively, these observational indicators suggest that the Earth’s climate system has undergone a profound transition since the late twentieth century. The evidence indicates not only increasing rates of change, but increasing rates of acceleration—a behavior that may be described as positive climate jerk.
This pattern is consistent with a climate system increasingly influenced by reinforcing feedbacks, interacting tipping elements, and cascading Earth-system responses.
Across multiple domains—including ice-sheet dynamics, ocean heat uptake, hydrological extremes, atmospheric circulation, wildfire amplification, and permafrost thaw—the emerging signal is coherent: the climate system is not only changing, but accelerating, with the rate of acceleration itself increasing over time.
Understanding this higher-order behavior may be important for improving the characterization of future climate risk, particularly under conditions where nonlinear feedbacks play a larger role in system evolution.
In this context, projected warming outcomes become increasingly sensitive to the strength, interaction, and persistence of Earth-system feedbacks.
Current scenario ranges include:
* Linear or weak-feedback estimates: ~3–5°C
* Strong-feedback scenarios: ~6–9°C (upper-range outcomes under sustained positive feedback participation)
* Long-term high-impact pathways: >10°C over multi-century timescales (often discussed within “Hothouse Earth” framework contexts)
The Domino Effect: An example of an interacting Earth-system cascade
Polar amplification → reduced equator-to-pole temperature gradient → weakened thermal contrast that influences large-scale atmospheric circulation → accelerated Arctic and Greenland ice loss → increased freshwater discharge into the North Atlantic, reducing surface-water salinity and density → weakening of deep-water formation and increasing risk of Atlantic Meridional Overturning Circulation (AMOC) slowdown → reorganization of North Atlantic pressure patterns and storm tracks → greater jet-stream waviness, slower progression, and amplified Rossby-wave behavior → more persistent blocking patterns, omega blocks, and meridional flow → longer-lasting atmospheric rivers, heat domes, drought–flood whiplash, and other hydroclimatic extremes → increasing stress on agriculture, infrastructure, ecosystems, water resources, and public health → continued land-ice loss and groundwater redistribution that alter Earth’s mass distribution → climate-driven mass redistribution sufficient to measurably change Earth’s moment of inertia, contributing to small changes in Earth’s rotation and the length of day.
Example: Jerk-Behavior in Earth’s Rotation
Methodology
To illustrate long-term changes in climate acceleration, each indicator was normalized to a common baseline:
1990s = 1.0
Relative observational behavior was then estimated for each subsequent decade.
If the decade-to-decade increases become progressively larger, the indicator exhibits positive acceleration.
If the acceleration itself continues increasing over time, this represents positive climate jerk—the rate at which acceleration is increasing.
In physics:
- Velocity describes the rate of change.
- Acceleration describes the rate at which velocity changes.
- Jerk describes the rate at which acceleration changes.
Applied to climate science, positive climate jerk indicates that Earth’s climate is not simply changing faster—it is accelerating faster over time.
Clarification of Timescale Compression and Notation
The “5–10× compression” and the “2^6 factor” do not describe the same single-step change. They represent different ways of summarizing multi-stage changes across multiple indicators and time intervals.
The 5–10× compression refers to a direct comparison of characteristic doubling times between earlier and later historical regimes (e.g., century-scale versus decade-scale behavior). This range reflects variability across indicators, datasets, and definitions of baseline periods.
The 2^6 expression is a shorthand for successive halving behavior across multiple sequential transitions. It describes compounded changes in effective timescales across stages rather than a single-step century-to-decade ratio. Interpreted as a direct ratio, 64× would be inconsistent with a simple 100-year to 10-year comparison, which is why that interpretation is not intended.
Multiple climate indicators now point to rates of warming-related disruption far beyond those observed during the modern instrumental era. There is no well-established geological analog for a sustained, multi-variable, decade-scale pattern of accelerating change across the full Earth system at the resolution available in contemporary observations.
In summary:
- Century → decade scaling is approximately a 10× change in a single framing
- The 5–10× range reflects observational variability across indicators and methods
- The 2^6 notation represents cumulative nonlinear compression across multiple stages, not a single-step ratio applied to one dataset
1. Hydrological Extremes and Climate Whiplash
| Decade | Index |
|---|---|
| 1990s | 1.0 |
| 2000s | 1.5 |
| 2010s | 3.0 |
| 2020s | 7.0 |
Decadal increase: +0.5 → +1.5 → +4.0
Acceleration: +1.0 → +2.5
Climate Jerk: Extremely Strong
2. Ocean Heat Content
| Decade | Index |
|---|---|
| 1990s | 1.0 |
| 2000s | 1.7 |
| 2010s | 3.2 |
| 2020s | 6.0 |
Decadal increase: +0.7 → +1.5 → +2.8
Acceleration: +0.8 → +1.3
Climate Jerk: Very Strong
3. Sea-Level Rise
| Decade | Index |
|---|---|
| 1990s | 1.0 |
| 2000s | 1.3 |
| 2010s | 2.0 |
| 2020s | 3.5 |
Decadal increase: +0.3 → +0.7 → +1.5
Acceleration: +0.4 → +0.8
Climate Jerk: Strong
4. Ice-Sheet Mass Loss (Greenland and Antarctica Combined)
| Decade | Index |
|---|---|
| 1990s | 1.0 |
| 2000s | 2.5 |
| 2010s | 7.0 |
| 2020s | 15.0 |
Decadal increase: +1.5 → +4.5 → +8.0
Acceleration: +3.0 → +3.5
Climate Jerk: Extremely Strong
5. Rossby Wave Amplification
| Decade | Index |
|---|---|
| 1990s | 1.0 |
| 2000s | 1.4 |
| 2010s | 2.3 |
| 2020s | 4.0 |
Climate Jerk: Strong
6. Atmospheric River Intensity
| Decade | Index |
|---|---|
| 1990s | 1.0 |
| 2000s | 1.3 |
| 2010s | 2.2 |
| 2020s | 4.5 |
Climate Jerk: Very Strong
7. Permafrost Thaw and Methane Release
| Decade | Index |
|---|---|
| 1990s | 1.0 |
| 2000s | 1.4 |
| 2010s | 2.5 |
| 2020s | 5.0 |
Climate Jerk: Very Strong
8. Wildfire Feedback Amplification
| Decade | Index |
|---|---|
| 1990s | 1.0 |
| 2000s | 1.5 |
| 2010s | 3.0 |
| 2020s | 7.5 |
Climate Jerk: Extremely Strong
9. Wet-Bulb Temperature Exceedances
| Decade | Index |
|---|---|
| 1990s | 1.0 |
| 2000s | 1.6 |
| 2010s | 2.8 |
| 2020s | 5.0 |
Climate Jerk: Strong
10. Nighttime Minimum Temperatures
| Decade | Index |
|---|---|
| 1990s | 1.0 |
| 2000s | 1.4 |
| 2010s | 2.1 |
| 2020s | 3.5 |
Climate Jerk: Moderate to Strong
Composite Climate Jerk Index
A simple average of the ten normalized indicators produces the following composite behavior:
| Decade | Composite Index |
|---|---|
| 1990s | 1.00 |
| 2000s | 1.56 |
| 2010s | 3.01 |
| 2020s | 6.10 |
Decadal increases: +0.56 → +1.45 → +3.09
Acceleration: +0.89 → +1.64
Sources and Resources
Foundational Domino Effect Research- Observational Evidence for Climate Jerk: Multidisciplinary Indicators of Accelerating Climate Acceleration
- The Acceleration of U.S. Climate-Linked Economic Burden (1890–2040 Projection)
- The Compression of Doubling Times Across Earth-System Indicators: Evidence for Increasing Nonlinearity in the Climate System
- Observational Evidence of Climate Jerk
- Beyond Average Warming: Temperature Extremes, Nighttime Heat, and the Emergence of Climate Jerk
- Calculating the Rate of Climate Acceleration in a Nonlinear Earth System
- Jerk-Behavior in Earth’s Rotation: Climate Change, the Third Derivative, and Emerging Risks to Precision Navigation
- A Unified Energetics Framework for Accelerating Climate Change: From Radiative Forcing to Drag Physics
- Singularity: Public Access Version (6th-grade level)
- Singularity: Easy Version (~8th–10th grade level)
- Singularity: Journal-Ready Version (~college graduate level)
* Our probabilistic, ensemble-based climate model — which incorporates complex socio-economic and ecological feedback loops within a dynamic, nonlinear system — projects that global temperatures are becoming unsustainable this century. This far exceeds earlier estimates of a 4°C rise over the next thousand years, highlighting a dramatic acceleration in global warming. We are now entering a phase of compound, cascading collapse, where climate, ecological, and societal systems destabilize through interlinked, self-reinforcing feedback loops.
We examine how human activities — such as deforestation, fossil fuel combustion, mass consumption, industrial agriculture, and land development — interact with ecological processes like thermal energy redistribution, carbon cycling, hydrological flow, biodiversity loss, and the spread of disease vectors. These interactions do not follow linear cause-and-effect patterns. Instead, they form complex, self-reinforcing feedback loops that can trigger rapid, system-wide transformations — often abruptly and without warning. Grasping these dynamics is crucial for accurately assessing global risks and developing effective strategies for long-term survival.